SCEC News articles about the 2000 Internship program:
Interns and their projects:

|
Marie Ammerman
UC Santa Barbara
|
Ralph Archuleta, UC Santa Barbara |
|
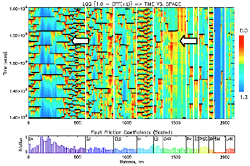
Project: Inconclusive Evidence for Fault Zone Trapped Waves on the Bullion Fault
Progress Report
Final Report (Acrobat pdf)
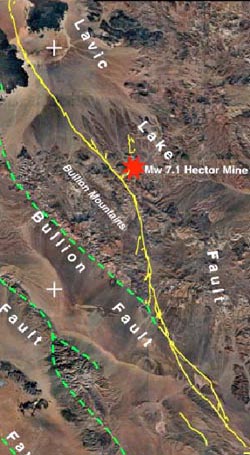 Aftershocks recorded by stations in the Bullion Wash Array lacked the arrival of seismic waves that characterize the fault zone trapped waves observed by Li et al., 1994. The arrivals following the S wave were more prominent on fault parallel and vertical components of the seismometers than on the fault perpendicular components- inconsistent with a Love wave type mode trapped in a fault zone. The waves following the S wave did not show consistent amplitudes on stations within the fault zone with a decrease in amplitude for stations farther away from the fault trace. The apparent lack of fault zone trapped waves may be due to the juvenile nature of the Bullion fault zone, i.e., it is not well enough developed to generate trapped waves. The observed post-S waves may be basin edge generated waves caused by a wedge of sediments that underlies the array (Dibblee, 1967). The presence of edge generated surface waves would explain why the waves are more prominent on fault parallel and vertical components. Aftershocks recorded by stations in the Bullion Wash Array lacked the arrival of seismic waves that characterize the fault zone trapped waves observed by Li et al., 1994. The arrivals following the S wave were more prominent on fault parallel and vertical components of the seismometers than on the fault perpendicular components- inconsistent with a Love wave type mode trapped in a fault zone. The waves following the S wave did not show consistent amplitudes on stations within the fault zone with a decrease in amplitude for stations farther away from the fault trace. The apparent lack of fault zone trapped waves may be due to the juvenile nature of the Bullion fault zone, i.e., it is not well enough developed to generate trapped waves. The observed post-S waves may be basin edge generated waves caused by a wedge of sediments that underlies the array (Dibblee, 1967). The presence of edge generated surface waves would explain why the waves are more prominent on fault parallel and vertical components.
|

|
Teresa Baker
Massachusetts Institute of Technology |
Susan Owen, Univ. of Southern California |
|
Project: Afterslip Models of Postseismic Deformation from the 1999 M7.1 Hector Mine Earthquake
Progress Report
Final Report (Acrobat pdf)
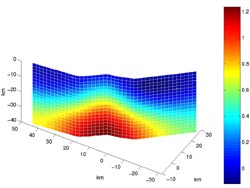 Following the October 16, 1999 M=7.1 Hector Mine earthquake there has been a focused effort by SCEC researchers to collect postseismic surface deformation data in the region surrounding the fault rupture. Using campaign and continuous GPS data collected by SCIGN, the USGS, USC, UCLA, UCSD and MIT, we calculated postseismic velocities at more than 50 sites. By measuring the postseismic deformation we can quantify the crustal response to the earthquake and model the distribution of afterslip on the fault at depth. This is important for understanding the mechanics of the lower crust and the postseismic period of the earthquake cycle. Following the October 16, 1999 M=7.1 Hector Mine earthquake there has been a focused effort by SCEC researchers to collect postseismic surface deformation data in the region surrounding the fault rupture. Using campaign and continuous GPS data collected by SCIGN, the USGS, USC, UCLA, UCSD and MIT, we calculated postseismic velocities at more than 50 sites. By measuring the postseismic deformation we can quantify the crustal response to the earthquake and model the distribution of afterslip on the fault at depth. This is important for understanding the mechanics of the lower crust and the postseismic period of the earthquake cycle.
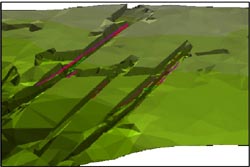
The postseismic deformation field follows the expected pattern of continued right-lateral displacement. The highest velocities occur 20-40 km from the surface rupture and the velocities subsided significantly over a nine month period. The velocities decay rapidly in the first month following the earthquake and more slowly afterwards. Taking this into account, we have modeled the distribution of slip over three time periods. In the model, the fault extends from the surface rupture to 40 km depth and also extends 20 km beyond the ends of surface trace. This fault surface was then discretized into 2 km by 2 km squares, and we estimated the slip on each square, applying a smoothing constraint to regularize the slip distribution. While variations in data quality over these different time periods affect our model resolution, it appears that the region of maximum slip moves northeast along the fault over time.
|

|
Allison Jacobs
UC San Diego
|
David Sandwell, UC San Diego |
|
Project: Hector Mine: Postseismic Deformation from ERS InSAR
Progress Report
Final Report (Acrobat pdf)
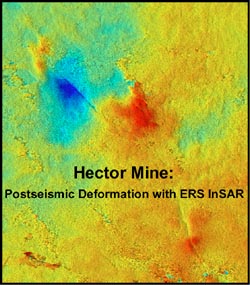 The Hector Mine earthquake occurred on October 16, 1999, in the Mojave Desert of California. Four days later, the European Space Agency satellite, ERS-2, flew over the region, bouncing radar waves off the desert surface to produce the first co-seismic synthetic aperture radar (SAR) image of the area. The collection of this data was also highly important for studying postseismic deformation since the most significant earthquake deformation usually occurs within the first 40 days after the main shock. We were fortunate to match this key image with data received on June 21, 2000, at the Scripps Institution of Oceanography satellite ground station, and create a postseismic interferogram covering this critical time period. Using the interferogram we contoured the line-of-sight (LOS) displacement in the fault region. The three main deformation features seen in the line of sight displacement map are a region of subsidence (40 mm line of sight increase) on the northwestern side of the fault, a region of uplift (65 mm line of sight decrease) located to the northeast of the primary fault bend, and a linear trough running along the main rupture of the fault. These features coincide well with a characteristic left-bending, right-lateral strike-slip fault that ideally exhibits contraction on the restraining side of the fault bend and extension along the opposite side. In this initial postseismic interferogram, the areas of subsidence and uplift combine to display a maximum amount of displacement of nearly 105 mm. A second interferogram made from images taken 39 days and 139 days after the earthquake shows a significant decrease in the amount of displacement (maximum displacement of 50 mm). This smaller deformation indicates that most of the relaxation occurs within about 40 days of the main shock. The co-seismic and postseismic interferograms created for this study are on display at http://topex.ucsd.edu. The Hector Mine earthquake occurred on October 16, 1999, in the Mojave Desert of California. Four days later, the European Space Agency satellite, ERS-2, flew over the region, bouncing radar waves off the desert surface to produce the first co-seismic synthetic aperture radar (SAR) image of the area. The collection of this data was also highly important for studying postseismic deformation since the most significant earthquake deformation usually occurs within the first 40 days after the main shock. We were fortunate to match this key image with data received on June 21, 2000, at the Scripps Institution of Oceanography satellite ground station, and create a postseismic interferogram covering this critical time period. Using the interferogram we contoured the line-of-sight (LOS) displacement in the fault region. The three main deformation features seen in the line of sight displacement map are a region of subsidence (40 mm line of sight increase) on the northwestern side of the fault, a region of uplift (65 mm line of sight decrease) located to the northeast of the primary fault bend, and a linear trough running along the main rupture of the fault. These features coincide well with a characteristic left-bending, right-lateral strike-slip fault that ideally exhibits contraction on the restraining side of the fault bend and extension along the opposite side. In this initial postseismic interferogram, the areas of subsidence and uplift combine to display a maximum amount of displacement of nearly 105 mm. A second interferogram made from images taken 39 days and 139 days after the earthquake shows a significant decrease in the amount of displacement (maximum displacement of 50 mm). This smaller deformation indicates that most of the relaxation occurs within about 40 days of the main shock. The co-seismic and postseismic interferograms created for this study are on display at http://topex.ucsd.edu.
|

|
Alexandra Jordan
Univ. of Southern California
|
Mark Benthien, Univ. of Southern California |
|
Project: Setting the Stage for a HAZUS User Group in Southern California
Progress Report
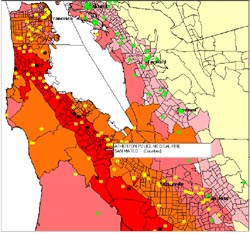 This summer I worked on a project with Mark Benthien and Jill Andrews to help promote the computer application, HAZUS. HAZUS, or "Hazards US", is a PC-based Geographic Information Systems software used for earthquake loss mitigation. The application is used to collect an over report of the amount of damage that may occur to one area affected by an earthquake. Our main goal, along with working with HAZUS and learning more about the application, was to help form a Southern California User Group. At the beginning of the summer we traveled to the San Francisco Bay Area and joined a workshop for users of the already existing Bay Area User Group. By observing and talking with many of the participants we were able to get an idea of the future goals and accomplishments geared toward the formation of a Southern California User Group. The Bay Area User Group has acted as a model for the kind of user group we are hoping to establish. To gain more knowledge on what people in the southern California region already know and think about HAZUS, I designed a survey of 10 questions related to the application. I called between 25 and 30 people and asked them about their interests and knowledge of HAZUS. Most people seemed enthusiastic to participate in future functions related to HAZUS and hoped to hear more information about our progress. These results will provide the SCEC Board of Directors with the information needed to structure a Southern California User Group. This summer I worked on a project with Mark Benthien and Jill Andrews to help promote the computer application, HAZUS. HAZUS, or "Hazards US", is a PC-based Geographic Information Systems software used for earthquake loss mitigation. The application is used to collect an over report of the amount of damage that may occur to one area affected by an earthquake. Our main goal, along with working with HAZUS and learning more about the application, was to help form a Southern California User Group. At the beginning of the summer we traveled to the San Francisco Bay Area and joined a workshop for users of the already existing Bay Area User Group. By observing and talking with many of the participants we were able to get an idea of the future goals and accomplishments geared toward the formation of a Southern California User Group. The Bay Area User Group has acted as a model for the kind of user group we are hoping to establish. To gain more knowledge on what people in the southern California region already know and think about HAZUS, I designed a survey of 10 questions related to the application. I called between 25 and 30 people and asked them about their interests and knowledge of HAZUS. Most people seemed enthusiastic to participate in future functions related to HAZUS and hoped to hear more information about our progress. These results will provide the SCEC Board of Directors with the information needed to structure a Southern California User Group.
|

|
Kevin Mass
Whittier College
|
Jan Vermilye, Whittier College |
|
Project: Pressure solution slip-faulting associated with the Quatal thrust fault
Progress Report
Final Report (Acrobat pdf)
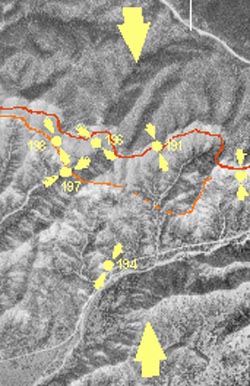 This study is based on the analysis of pressure solution strain structures to infer stress orientations. Sandstone and conglomerate outcrops located in Quatal Canyon (northern Ventura County, CA) have many types of pressure solution deformation structures. Small pressure solution slip-faults (cm to m in length) are a type of deformation structure that can be analyzed to infer the local and regional principal stresses. Field measurements of these faults are recorded at six locations in Quatal Canyon. These six data locations are then combined in order to determine the regional inferred stress axes. This study is based on the analysis of pressure solution strain structures to infer stress orientations. Sandstone and conglomerate outcrops located in Quatal Canyon (northern Ventura County, CA) have many types of pressure solution deformation structures. Small pressure solution slip-faults (cm to m in length) are a type of deformation structure that can be analyzed to infer the local and regional principal stresses. Field measurements of these faults are recorded at six locations in Quatal Canyon. These six data locations are then combined in order to determine the regional inferred stress axes.
The geometric and kinematic data are analyzed using the methodology of Michael (1984) and a program written by Allmendinger et al. (1992). The Michael (1984) analysis produces the orientation of the principal stress axes in the form of eigenvalues and eigenvectors. Allmendinger's program produces contour stereoplots of the P-axis (contraction) and T-axis (extension), as well as a fault plane solution plot representing the maximum strain directions for the combined data set.
The results of these analyses show the inferred stress and strain orientations at six locations throughout Quatal Canyon. The stress and strain orientations are displayed as stereoplots. The contraction and extension strain axes appear remarkably similar to the tension and compression stress axes, respectively. Therefore, it is valid to assume that the principal stress axes can be found using strain deformation structures. While a composite strain analysis indicates a typical thrusting regime, with sub-horizontal compression and near-vertical tension, individual outcrops show variability. A spatial explanation for this involves inhomogeneous stress around the fault due to the irregular shape of the Quatal fault. A temporal explanation involves translation of the Quatal fault along the San Andreas fault from the Garlock fault intersection to its present location.
|

|
Nancy Natek
University of New Mexico
|
Mousumi Roy, University of New Mexico |
|
Project: Constraints on the SCEC 3D Velocity Model from Gravity Data: Two-Dimensional Gravity Modeling of the Central and Eastern Transverse Ranges in the Los Angeles Region
Progress Report
Final Report (Acrobat pdf)
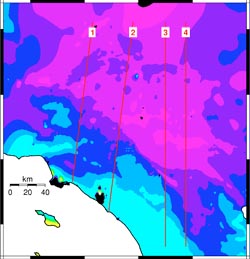 The goals of this project are to test the consistency of crustal seismic velocity structure and gravity data in the Transverse Ranges. Following earlier work by Roy and Clayton, we use 2D gravity models based on density structures inferred from crustal tomography. We use version 2 of the Southern California Earthquake Center (SCEC) velocity model and an empirically derived scaling relation between seismic velocities and density. The density structures thus inferred are used to forward model gravity along 2D profiles. The goals of this project are to test the consistency of crustal seismic velocity structure and gravity data in the Transverse Ranges. Following earlier work by Roy and Clayton, we use 2D gravity models based on density structures inferred from crustal tomography. We use version 2 of the Southern California Earthquake Center (SCEC) velocity model and an empirically derived scaling relation between seismic velocities and density. The density structures thus inferred are used to forward model gravity along 2D profiles.
We plan to compare predicted gravity along four 2D topographic profiles across the central and eastern Transverse Ranges to the observed gravity. This report shows our preliminary results for one of the profiles, with work in progress on the other three profiles. We find that, in general, gravity data and crustal tomographic structures are consistent with each other. However, we find that there are significant misfits in the eastern LA Basin and in the Mojave Desert. In order to obtain a good fit in the LA Basin, we were required to increase average densities in the basin, reducing the size of the negative Bouguer signal from basin sediments. The gravity anomaly in the Mojave Desert section of the profile is more negative than predicted, suggesting the presence of a subsurface crustal mass deficit. This region can be well-matched by increasing the depth to the Moho under the Mojave Desert, or, as shown by Roy and Clayton, by reducing average crustal densities in the Mojave.
|

|
Tracy Pattelena
Pasadena City College/ UC Santa Cruz
|
Kim Olsen, UC Santa Barbara |
|
Project: Refinement of Near-Surface P and S Wave Velocities in the SCEC 3-D Velocity Model Using 3-D Waveform Modeling
Progress Report
Final Report (Acrobat pdf)
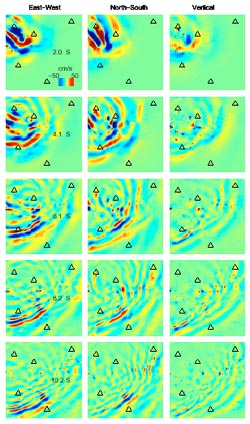 An important part of ground motion studies opts to predict full theoretical seismograms for an earthquake at a given site. Our study focuses on the ground motion in a portion of the San Fernando Valley (SFV) where control on the near-surface S wave velocity, a critical parameter for accurate prediction of strong ground motion, is mostly indirect and in many areas not well constrained. We use 1-Hz 3D finite-difference simulations to propagate waves for a M=5.1 Northridge aftershock through two 10 km by 10 km by 5 km models of the SFV subsurface: (1) a subset of the SCEC southern California reference 3D seismic velocity model (version 2.0), and (2) model 1 modified with slower velocities in the near-surface material taken from a tomographic model. Model 2 contains near-surface P and S velocities up to 70% and 50% less than those of model 1, respectively, in the upper 500 m. Compared to the response of model 1, the tomographically refined model (2) generates peak ground velocities (PGV) and cumulative kinetic energies (CKE) up to a factor of two in localized areas of the model. While the synthetics for model 2 improve the fit to data at the five stations only slightly, our simulations suggest that version 2.0 of the SCEC velocity model is not complex enough to reproduce the 1-Hz duration and peaks in the SFV basin. An important part of ground motion studies opts to predict full theoretical seismograms for an earthquake at a given site. Our study focuses on the ground motion in a portion of the San Fernando Valley (SFV) where control on the near-surface S wave velocity, a critical parameter for accurate prediction of strong ground motion, is mostly indirect and in many areas not well constrained. We use 1-Hz 3D finite-difference simulations to propagate waves for a M=5.1 Northridge aftershock through two 10 km by 10 km by 5 km models of the SFV subsurface: (1) a subset of the SCEC southern California reference 3D seismic velocity model (version 2.0), and (2) model 1 modified with slower velocities in the near-surface material taken from a tomographic model. Model 2 contains near-surface P and S velocities up to 70% and 50% less than those of model 1, respectively, in the upper 500 m. Compared to the response of model 1, the tomographically refined model (2) generates peak ground velocities (PGV) and cumulative kinetic energies (CKE) up to a factor of two in localized areas of the model. While the synthetics for model 2 improve the fit to data at the five stations only slightly, our simulations suggest that version 2.0 of the SCEC velocity model is not complex enough to reproduce the 1-Hz duration and peaks in the SFV basin.
|

|
Daniel Raymond
UC Irvine |
Lisa Grant, UC Irvine |
|
Project: Seismic Hazard Assessment of the San Joaquin Hills using GIS
Progress Report
Final Report (Acrobat pdf)
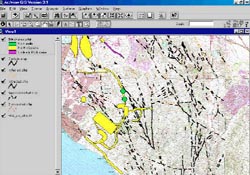 The San Joaquin Hills region of Orange County is undergoing rapid commercial and residential development. The anticlinal structure of the area is likely due to a combination of tectonic uplift and seismic activity on local fault systems. The goal of this project was to determine the hazards of the fault zones in the area while there may still be time to translate these findings into sound planning practices for the area. The San Joaquin Hills region of Orange County is undergoing rapid commercial and residential development. The anticlinal structure of the area is likely due to a combination of tectonic uplift and seismic activity on local fault systems. The goal of this project was to determine the hazards of the fault zones in the area while there may still be time to translate these findings into sound planning practices for the area.
Geotechnical and fault investigation reports were collected for as many sites as possible in the San Joaquin Hill region. The findings from these reports were then collected and transferred to a GIS-based map. This map was designed in such a way to allow a convenient regional view of report coverage and findings, and was linked to a more complete bibliography created to display report titles, conclusions and relevant trench logs. Because little conclusive or comprehensive information was found during this study, a strong case can be made for the need for further fault investigations in the San Joaquin Hills region.
|

|
Paul Rundle
Harvey Mudd College
|
John Rundle, University of Colorado |
|
Project: Nonlinear Network Dynamics on Earthquake Fault Systems
Paper in Physical Review Letters
 Earthquake faults occur in interacting networks having emergent spacetime modes of behavior not displayed by isolated faults. Using simulations of the major faults in southern California, we find that the physics depends on the elastic interactions among the faults defined by network topology, as well as on the non-linear physics of stress dissipation arising from friction on the faults. Our results have broad applications to other leaky threshold systems such as integrate-and-fire neural networks. Earthquake faults occur in interacting networks having emergent spacetime modes of behavior not displayed by isolated faults. Using simulations of the major faults in southern California, we find that the physics depends on the elastic interactions among the faults defined by network topology, as well as on the non-linear physics of stress dissipation arising from friction on the faults. Our results have broad applications to other leaky threshold systems such as integrate-and-fire neural networks.
|

|
Clay Stevens
California State University Northridge
|
Doug Yule, California State University Northridge |
|
Project: Three-dimensional excavation of the San Andreas Fault at the Burro Flats Paleoseismic site near Banning, California
Progress Report
Final Report (Acrobat pdf)
 Evidence from trenches opened in 1999 at Burro Flats suggested that the San Andreas fault at San Gorgonio Pass has remained dormant since about A.D. 1450. However, the 1999 trenches exposed a limited area of a complex, 150-m-wide stepover basin and may have missed evidence of more recent event(s). This summer an expanded trench network was excavated to search for evidence of more recent events. The new trenches show clear evidence of post-A.D. 1450 faulting and folding. The focus of my SCEC internship has been to construct contour maps of marker horizons and isopach maps of the intervening strata deposited in the last 550 years. Three marker horizons have been mapped over an area of about 1000 square meters. Marker horizon 84, near the base of the 550 year-old section, is faulted and folded into a syncline-anticline-syncline triad with a maximum structural relief of about 1.5 m that diminishes gradually to <0.25 m from south to north. Horizon 85, in the middle of the section, is not faulted and shows a maximum structural relief of about 0.6 m that also diminishes to the north. Horizon 88, near the top of the section, shows structural relief of 0.3 m or less. The modern ground surface is undeformed, dipping uniformly toward the southwest perpendicular to the fault. Sediment above horizon 85 is interpreted to have buried the folds and minor faulting that formed during the most recent event. Horizon 84 drapes a paleo-surface created by the penultimate event. The greater structural relief of horizon 84 is therefore attributed to deformation from both the most recent and penultimate events. Age data constrain the most recent event to between A.D. 1500 and 1800 and the penultimate event to between A.D. 1400 and 1550. Evidence from trenches opened in 1999 at Burro Flats suggested that the San Andreas fault at San Gorgonio Pass has remained dormant since about A.D. 1450. However, the 1999 trenches exposed a limited area of a complex, 150-m-wide stepover basin and may have missed evidence of more recent event(s). This summer an expanded trench network was excavated to search for evidence of more recent events. The new trenches show clear evidence of post-A.D. 1450 faulting and folding. The focus of my SCEC internship has been to construct contour maps of marker horizons and isopach maps of the intervening strata deposited in the last 550 years. Three marker horizons have been mapped over an area of about 1000 square meters. Marker horizon 84, near the base of the 550 year-old section, is faulted and folded into a syncline-anticline-syncline triad with a maximum structural relief of about 1.5 m that diminishes gradually to <0.25 m from south to north. Horizon 85, in the middle of the section, is not faulted and shows a maximum structural relief of about 0.6 m that also diminishes to the north. Horizon 88, near the top of the section, shows structural relief of 0.3 m or less. The modern ground surface is undeformed, dipping uniformly toward the southwest perpendicular to the fault. Sediment above horizon 85 is interpreted to have buried the folds and minor faulting that formed during the most recent event. Horizon 84 drapes a paleo-surface created by the penultimate event. The greater structural relief of horizon 84 is therefore attributed to deformation from both the most recent and penultimate events. Age data constrain the most recent event to between A.D. 1500 and 1800 and the penultimate event to between A.D. 1400 and 1550.
|

|
Kathryn van Roosendaal
California State University Northridge
|
Bob De Groot,
Univ. of Southern California |
|
Project: Seismic Sleuths 2001: Revision of a Tool of Scientific Literacy and a Renewal of Outreach Partnerships at the Southern California Earthquake Center
Progress Report
Final Report (Acrobat pdf)
 Seismic Sleuths, an earthquake education curriculum for grades 7-12, was developed jointly by AGU and FEMA in 1995. In 1999, NSF funded a revision of the curriculum under the direction of the Southern California Earthquake Center (SCEC). Revisions will reflect advances in science and technology especially the use of geodesy in earth science. This effort will provide an innovative opportunity to improve earth science education in several domains. Instruction in the classroom generally centers on teaching the conclusions of scientific investigation. Seismic Sleuths 2001 will be a resource for a basic integrated approach to the study of seismic phenomena while being a doorway into current research and controversies in earth science. The curriculum will harness the power of the World Wide Web forming partnerships across academe, government, and industry in order to tap the multi-disciplinary nature of earth science. The primacy of relevance, so well demonstrated in the original curriculum, will be enhanced and expanded to include issues related to all hazards that face citizens in the United States. Seismic Sleuths 2001 will allow individuals to make sense of the world around them, take action to reduce risk, and use technology that is an integral part of their lives without eclipsing the science that comprises the backbone of the curriculum. Seismic Sleuths, an earthquake education curriculum for grades 7-12, was developed jointly by AGU and FEMA in 1995. In 1999, NSF funded a revision of the curriculum under the direction of the Southern California Earthquake Center (SCEC). Revisions will reflect advances in science and technology especially the use of geodesy in earth science. This effort will provide an innovative opportunity to improve earth science education in several domains. Instruction in the classroom generally centers on teaching the conclusions of scientific investigation. Seismic Sleuths 2001 will be a resource for a basic integrated approach to the study of seismic phenomena while being a doorway into current research and controversies in earth science. The curriculum will harness the power of the World Wide Web forming partnerships across academe, government, and industry in order to tap the multi-disciplinary nature of earth science. The primacy of relevance, so well demonstrated in the original curriculum, will be enhanced and expanded to include issues related to all hazards that face citizens in the United States. Seismic Sleuths 2001 will allow individuals to make sense of the world around them, take action to reduce risk, and use technology that is an integral part of their lives without eclipsing the science that comprises the backbone of the curriculum.
|
|